

US Dollar: Mar ’23 USD is Down at 101.550.
Energies: Feb ’23 Crude is Up at 82.09.
Financials: The Mar ’23 30 Year T-Bond is Down 9 ticks and trading at 130.06.
Indices: The Mar ’23 S&P 500 emini ES contract is 20 ticks Lower and trading at 3983.50.
Gold: The Feb’23 Gold contract is trading Down at 1926.30. Gold is 19 ticks Lower than its close.
Initial conclusion
This is not a correlated market. The dollar is Down, and Crude is Up which is normal, but the 30 Year T-Bond is trading Lower. The Financials should always correlate with the US Dollar such that if the Dollar is lower, then the bonds should follow and vice-versa. The S&P is Lower, and Crude is trading Higher which is correlated. Gold is trading Lower which is not correlated with the US Dollar trading Down. I tend to believe that Gold has an inverse relationship with the US Dollar as when the US Dollar is down, Gold tends to rise in value and vice-versa. Think of it as a seesaw, when one is up the other should be down. I point this out to you to make you aware that when we don’t have a correlated market, it means something is wrong. As traders you need to be aware of this and proceed with your eyes wide open. Currently all of Asia is trading Higher. Europe is trading Higher as well with the exception of the Milan exchange which is Lower.
Possible challenges to traders today
Treasuries
Traders, please note that we’ve changed the Bond instrument from the 30 year (ZB) to the 10 year (ZN). They work exactly the same.
We’ve elected to switch gears a bit and show correlation between the 10-year bond (ZN) and the S&P futures contract. The S&P contract is the Standard and Poor’s, and the purpose is to show reverse correlation between the two instruments. Remember it’s likened to a seesaw, when up goes up the other should go down and vice versa.
On Friday the ZN hit a High at around 10 AM EST. The S&P was trading Lower at around the same time. If you look at the charts below ZN gave a signal at around 10 AM and the S&P gave a signal at around the same time. Look at the charts below and you’ll see a pattern for both assets. ZN hit a High at around 10 AM and migrated Lower. These charts represent the newest version of MultiCharts and I’ve changed the timeframe to a 15-minute chart to display better. This represented a Short opportunity on the 10-year note, as a trader you could have netted about 20 plus ticks per contract on this trade. Each tick is worth $15.625. Please note: the front month for the ZN is now Mar ’23. The S&P contract is now Mar’ 23 as well. I’ve changed the format to filled Candlesticks (not hollow) such that it may be more apparent and visible.
Charts courtesy of MultiCharts built on an AMP platform
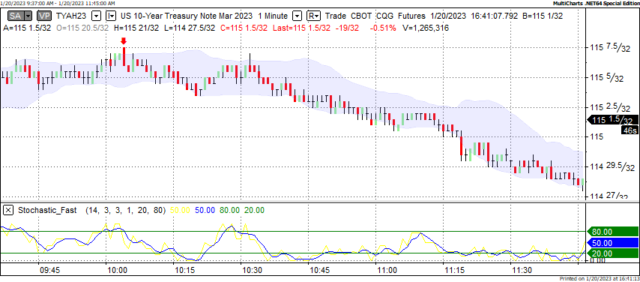
ZN – Mar 2023 – 1/20/23
-638100712987255380.png)
S&P – Mar 2023 – 1/20/23
Bias
On Friday we gave the markets a Neutral bias as we didn’t see much in the way of market correlation Friday morning, hence the Neutral bias. The Dow gained 331 points on the session and the other indices traded Higher as well. Today we aren’t dealing with a correlated market and our bias is Neutral.
Could this change? Of Course. Remember anything can happen in a volatile market.
Commentary
Janet Yellen warned on Thursday that not only was the debt ceiling reached on Thursday but by using “extraordinary measures” the US government would have until the early June timeframe to raise the Debt Ceiling or the US will start to default on loans and obligations. This would erase a 246-year tradition of paying debts on time. The good news is Secretary Yellen has provided some breathing room for both parties to start talking with one another. President Biden has invited Speaker McCartney to the White House to further these discussions. Speaker McCartney has accepted, so these are promising signs. Let’s see if they bear some fruit.
Source link
