Design and construction of a novel electrochemical NO generator
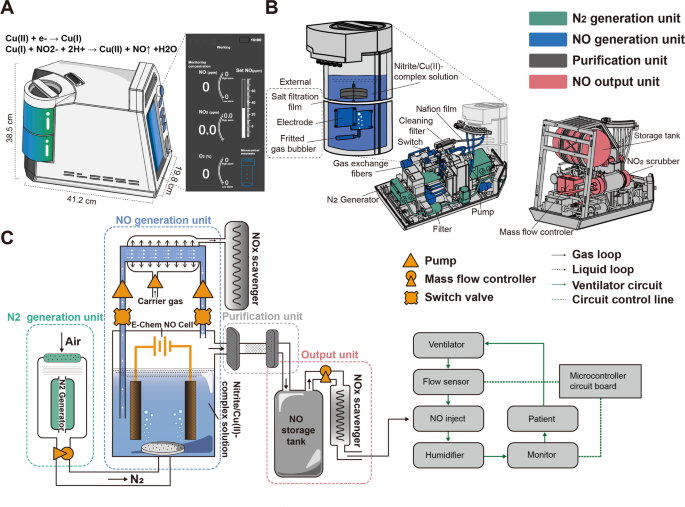
To meet the demands of NO in-home inhalation therapy in patients with PAH, we designed a controllable NO generator based on the electrochemical reduction of nitrite. In this novel device, substantial amounts of NO are electrochemically produced on the surface of an Au mesh electrode via reduction of a nitrite solution in the presence of copper (II)1,4,7-trimethyl-1,4,7-triazacyclononane (Cu(II)Me3TACN) without producing toxic byproducts. The ENG can rapidly produce high-purity NO with just one knob, which allows for bedside or in-home operation. To enable portable use, the NO generator had a very small design (41.2 cm × 38.5 cm × 19.8 cm) and only weighed 15 kg in total. This device is simple to operate with a single knob, and the real-time gas concentrations of NO, NO2, and O2 are displayed on a user-friendly interface (Fig. 1A).
Design, configuration, and schematic of a novel ENG model. A Appearance, size, and configuration of the ENG. B Detailed positioning of each unit inside the highly integrated NO generator. C Schematic diagram of the ENG that consists of 4 sequentially connected units and two work modes controlled by a switch valve. The NO generator was connected to the ventilator pipeline and supervised by the circuit board
The highly integrated ENG is composed of a nitrogen generation unit, a NO generation unit, a purification unit, and an output unit (Fig. 1B). The nitrogen generation unit is located at the bottom and contains a nitrogen-generating device and a filter device. The compressed air is filtered by a filter device to ensure that the dust, the particulate matter, or the aerosol has no influence on the ENG, and then the air enters the nitrogen-generating device, where oxygen (O2) and nitrogen (N2) are separated by their different permeation rates through the hollow fiber membrane. The NO generation unit is located next to the nitrogen generation unit and contains an external electrolytic module with a circular connection and a built-in gas exchange fiber. The electrolytic module is a consumable part that is easy to replace and has the capacity to generate NO at a volume equivalent to that of five 8 L NO cylinders. The gas exchange fiber is responsible for removing residual NO from the electrolyte. A purification unit consisting of a salt filtration film, Nafion film, and cleaning filter is located between the NO generation and output units to eliminate salt mist, moisture, and any impurities that may harm patients. The output unit is located at the top and includes a NO storage tank and a NO2 scrubber coated with ascorbic acid for reducing NO2 to NO.
The ENG can work in two modes (Fig. 1C). The first mode is for the rapid production of high-flow NO generated with a fritted gas bubbler. In this mode, the air is compressed and filtered into the nitrogen generation unit to achieve ≥99.0% N2, which is sprayed into the electrolytic cell through a purge to sweep away the NO generated in the electrolytic tank. The purified NO is mixed with N2 at a certain proportion in the storage tank, and the residual NO2 is reduced to NO in the NO2 scrubber. Then, NO is readily available for medical use. The ENG can be connected to a mask for direct inhalation or connected to the ventilator outlet that is supervised and regulated by a microcontroller. In the second mode, the electrolyte solution is directed from the electrolytic cell and flows through a reflux tube lined with a silicon fiber membrane, during which residual NO is extracted into the NOx absorbent. This extraction process is initiated by switching the valve and prevents chemical erosion of the electrode by residual NO in the solution when NO release is terminated.
Overall, our novel NO generator model was designed to synthesize, purify, recycle, and release NO in a compact and portable device. Given its small size and convenient replacement of consumables, this device has great potential for use in diverse clinical settings, including in-hospital treatment and in-home usage for patients with PAH.
NO production efficiency and byproducts monitoring
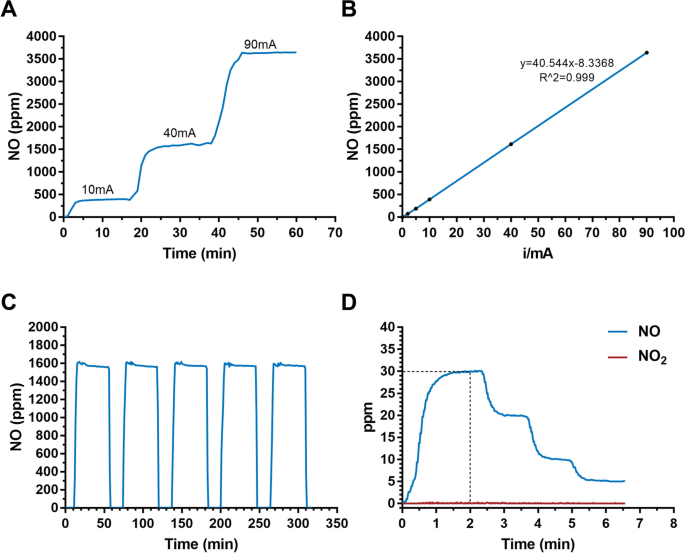
We next tested the efficiency of NO production by applying consecutive currents from 10 to 90 mA on the electrodes in the ENG. A wide range of NO concentrations from 390 ppm to 3500 ppm was produced, and the switch time of NO production was less than 5 min (Fig. 2A). Importantly, the level of NO increased in a linear manner with increasing current applied to the electrodes, providing a theoretical basis for the sustained and precise release of NO (Fig. 2B). To understand the actual gas production efficiency, we tested the Faraday efficiency. With 40 mA current, the Faraday efficiency is about 74%. The value decreases with higher current and varies between 61~74%. Moreover, the electrolytic cell could generate a constant level of NO for five consecutive time periods (Fig. 2C), indicating its excellent reliability for the precise control of NO production at a fixed concentration. To confirm the generation rate and safety of the released NO, we monitored NO and NO2 simultaneously at the terminus of the pipeline. The results showed that ENG could reach the desired dose of NO within 2 min and NO2 was at an extremely low concentration (< 1 ppm) regardless of the therapeutic NO dose (Fig. 2D). Moreover, NO2 also remained at extremely low levels under a wider range of generated NO (Additional file 1: Table S1, Figure S1). According to ISO 18562:2017 biocompatibility evaluation of breathing gas pathways in healthcare applications, we further tested the emission of VOCs and particles at the terminus of the pipeline. The results showed that VOCs were below the threshold of toxicological concerns for the patient with different ages (Additional file 1: Table S2-S5). Moreover, it was shown that the particles were less than 10μg/m3, which is also in the safety ranges (Additional file 1: Table S6).
NO production and NO2 monitoring with the ENG. A NO concentration monitoring in the solution with different levels of applied current. B The linear relationship between the calibrated NO concentration and applied currents. C NO levels generated for five consecutive time periods. D NO2 levels under therapeutic doses of NO
Taken together, these results demonstrated that our ENG has an excellent capacity for efficient, sustainable, and stable NO production, with a wide adjustment range and minimal byproducts production.
Establishment of a porcine model of PAH
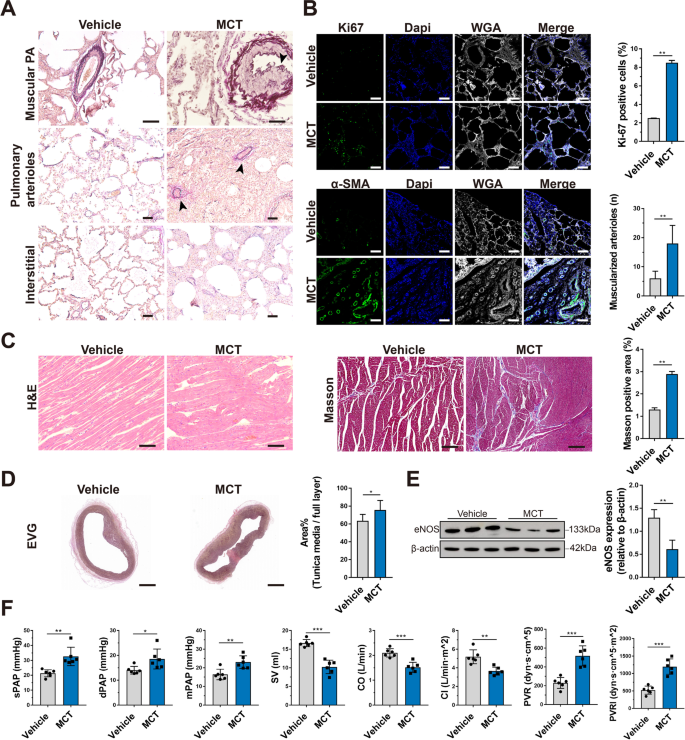
To examine the efficacy of the ENG for treating PAH, we established a porcine model by intraperitoneal injection of 12 mg/kg MCT twice (Additional file 1: Table S7 and Table S8). EVG elastic staining of lung tissues in the MCT group revealed uneven thickening of the middle layer of the pulmonary arteries, accompanied by lumen stenosis (black arrow), much more muscularized small pulmonary arterioles (black arrows), and pulmonary interstitial hyperplasia with inflammatory cell infiltration (Fig. 3A). Ki67 (P<0.01, n=3) and α-SMA (P<0.01, n=3) immunofluorescence staining of lung tissues revealed significantly increased vascular wall proliferation and thickening of the pulmonary arterioles in the MCT group compared with the vehicle group (Fig. 3B). H&E staining of the right ventricle showed distinct edema and disorder of cardiomyocytes in the MCT group, and Masson staining revealed a higher burden of myocardial fibrosis in the MCT group (P<0.01, n=3) (Fig. 3C). Moreover, the MCT group also showed an extensively thickened tunica media in the main pulmonary artery (P<0.05, n=3) (Fig. 3D). In addition, western blotting showed that endothelial nitric oxide synthase (eNOS) levels were significantly decreased in the MCT group compared with the vehicle group, indicating that endothelial synthesis of endogenous NO was attenuated in PAH (P<0.01, n=3) (Fig. 3E). From a hemodynamic perspective, higher sPAP (P=0.002, F=1.637, df=10, n=6), dPAP (P=0.027, F=2.384, df=10, n=6), mPAP (P=0.004, F=0.509, df=10, n=6), PVR (P=0.001, F=3.66, df=10, n=6), and PVRI (P=0.001, F=2.656, df=10, n=6) and lower stroke volume (SV) (P=0.001, F=2.932, df=10, n=6), CO (P=0.001, F=0.097, df=10, n=6), and CI (P=0.001, F=6.585, df=10, n=6) were observed in the MCT group than in the vehicle group (Fig. 3F). These results suggest that the MCT-induced PAH porcine model was successfully established and could be used to evaluate the therapeutic effect of the ENG.
Establishment of a porcine PAH model. A EVG elastic staining of the lungs shows the pathological changes in piglets with MCT-induced PAH and the vehicle-treated group. The arrows indicate uneven thickening of the middle layer of the pulmonary arteries, with lumen stenosis, muscularized pulmonary arterioles, and lung interstitial thickening with inflammatory cell infiltration. B Immunofluorescence staining of Ki67 and α-SMA in paraffin-embedded sections of lung tissue from piglets with MCT-induced PAH or the vehicle-treated group. Scale bars, 50 μm. C H&E staining and Masson staining of the right ventricular myocardium of piglets with MCT-induced PAH or the vehicle-treated group. Scale bars, 50 μm for H&E staining and 100 μm for Masson staining. D EVG staining of the tunica media of the main pulmonary artery of piglets with MCT-induced PAH or the vehicle-treated group. Scale bars, 2 mm. E Representative images and quantification of eNOS expression in the lung tissues of piglets with MCT-induced PAH or the vehicle-treated group by western blotting. F Hemodynamic data for the pulmonary circulation, including sPAP, dPAP, mPAP, SV, CO, CI, PVR, and PVRI, were measured and calculated by catheter intervention in piglets with MCT-induced PAH or the vehicle-treated group. * P<0.05, ** P<0.01, *** P<0.001; compared to the vehicle group, as analyzed by Student’s t test
The electrochemical NO generator could alleviate PAH in a porcine model
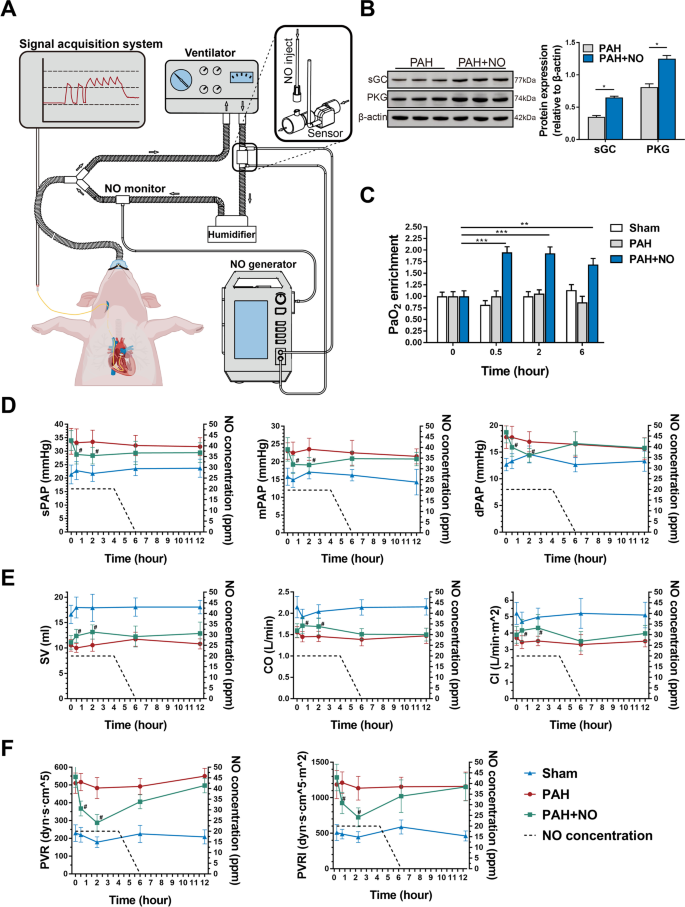
By using a porcine model of PAH, we further explored whether the ENG could reduce PAP. We connected the ENG to a ventilator and recorded changes in PAP with a Swan-Ganz catheter before and after NO inhalation (Fig. 4A). In the PAH+NO group, animals inhaled NO at 20 ppm for 4 h as the initial dose, and the NO concentration decreased at a rate of 10 ppm per hour in the following 2 h. After NO inhalation, the expression of soluble guanylate cyclase (sGC) (P<0.05, n=3) and PKG (P<0.05, n=3) was significantly increased, indicating that inhaled NO activated the cGMP-mediated signaling pathway (Fig. 4B). As expected, arterial blood gas analysis showed that PaO2 enrichment was significantly increased compared to 0.5h (P<0.001), 2h (P<0.001), and 6h (P<0.01) after NO inhalation (Fig. 4C and Additional file 1: Table S9). Compared to the PAH group, the PAH+NO group showed significantly lower levels of sPAP (P=0.045 at 0.5h, P=0.032 at 2h), dPAP (P=0.05 at 0.5h, P=0.030 at 2h) and mPAP (P=0.036 at 0.5h, P=0.006 at 2h) at post-inhalation (Fig. 4D), accompanied by consistent improvements in SV (P=0.007 at 0.5h, P=0.003 at 2h), CO (P=0.005 at 0.5h, P=0.013 at 2h) and CI (P=0.026 at 0.5h, P=0.014 at 2h) (Fig. 4E). In addition, the calculated PVR (P=0.001 at 0.5h, P=0.001 at 2h) and PVRI (P=0.007 at 0.5h, P=0.001 at 2h) were alleviated at the same time point in the PAH+NO group (Fig. 4F).
The ENG effectively alleviated hypoxemia and improved pulmonary hemodynamics in the porcine PAH model. A A schematic of the connection of the ENG to the ventilator and the acquisition of hemodynamic data. B Western blotting for sGC and PKG in the lung tissues of piglets with PAH in the presence or absence of NO inhalation (n=6/group). C PaO2 detection in piglets with PAH in the presence or absence of NO inhalation or the sham group at the indicated timepoint (n=6/group). D–F The measurement of PAP (D); SV, CO, and CI (E); and PVR and PVRI (F). * P<0.05, ** P<0.01; compared to the PAH group, as analyzed by Student’s t test (B) or two-way ANOVA with repeated measures (C–F)
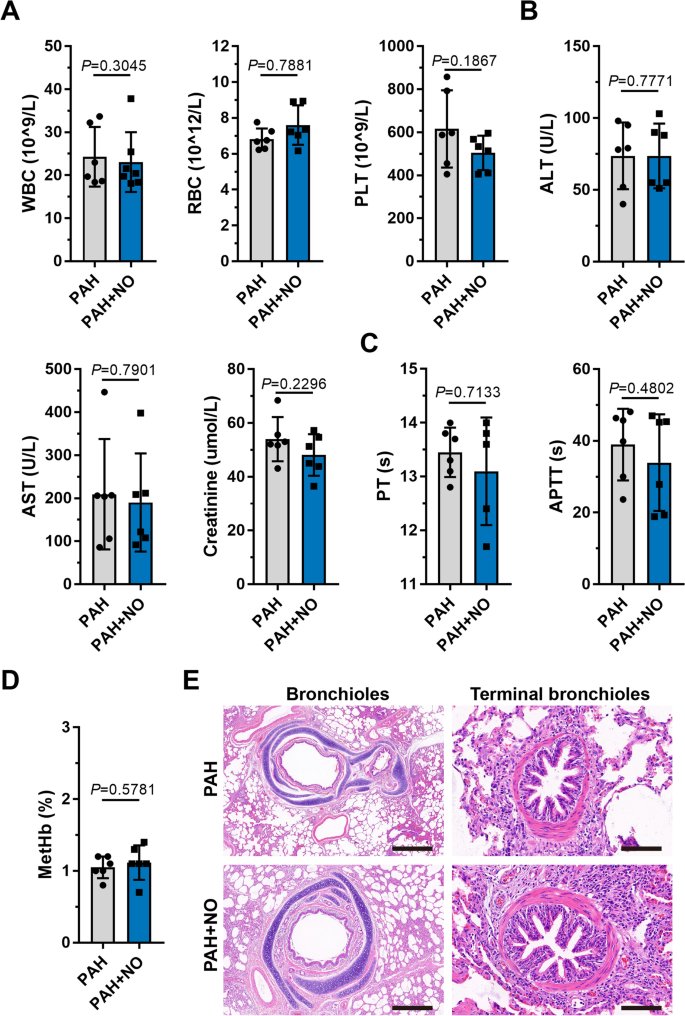
Blood tests, serum biochemistry, and coagulation examinations revealed no significant differences (P>0.05) before and after the application of the ENG (Fig. 5A–C, Additional file 1: Table S10), suggesting minimal hepatotoxicity and hematologic toxicity. After ENG treatment, methemoglobin in the PAH+NO group remained at a normal level and did not significantly increase when compared with that in the PAH group (P>0.05) (Fig. 5D), indicating that the therapeutic concentration of NO produced by the ENG did not cause methemoglobinemia. In pathology, the ENG did not cause significant injuries to lung bronchioles and terminal bronchi in PAH piglets (Fig. 5E).
Examination of physiological indicators and lung pathology after NO inhalation with the ENG. A–D Comparison of blood cells (A); hepatic and renal function (B); procoagulant function (C); and methemoglobin (D) between piglets with PAH treated with the ENG and those not treated with the ENG; compared to the PAH group, as analyzed by Student’s t test. E H&E staining of paraffin sections of bronchioles (scale bars, 500 μm) and terminal bronchi (scale bars, 50 μm)
Collectively, we confirmed in a porcine PAH model that the ENG can effectively alleviate hemodynamic compromise and improve cardiac functions at a therapeutic level of delivered NO without causing hematologic, hepatic disruptions, and lung injuries.
Source link

