

Warren Buffett famously said, ‘Volatility is far from synonymous with risk.’ When we think about how risky a company is, we always like to look at its use of debt, since debt overload can lead to ruin. We can see that PTC Inc. (NASDAQ:PTC) does use debt in its business. But the real question is whether this debt is making the company risky.
Why Does Debt Bring Risk?
Debt is a tool to help businesses grow, but if a business is incapable of paying off its lenders, then it exists at their mercy. In the worst case scenario, a company can go bankrupt if it cannot pay its creditors. However, a more frequent (but still costly) occurrence is where a company must issue shares at bargain-basement prices, permanently diluting shareholders, just to shore up its balance sheet. Of course, the upside of debt is that it often represents cheap capital, especially when it replaces dilution in a company with the ability to reinvest at high rates of return. The first step when considering a company’s debt levels is to consider its cash and debt together.
View our latest analysis for PTC
How Much Debt Does PTC Carry?
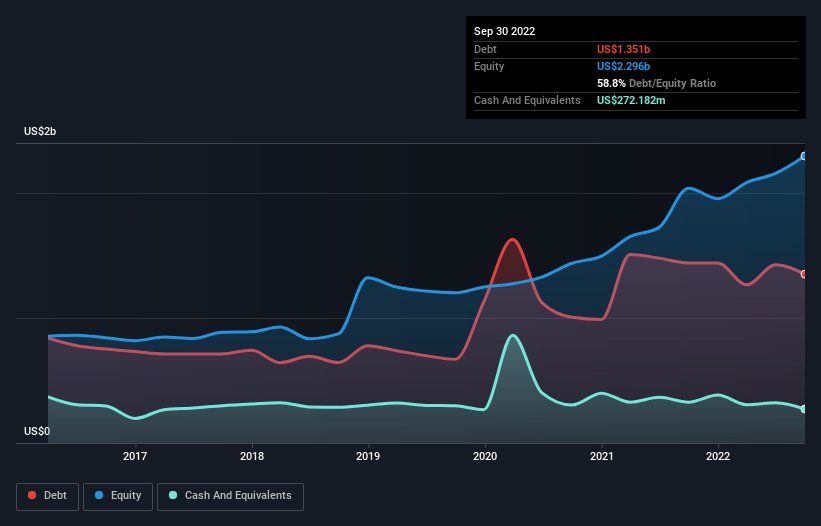
The image below, which you can click on for greater detail, shows that PTC had debt of US$1.35b at the end of September 2022, a reduction from US$1.44b over a year. However, it also had US$272.2m in cash, and so its net debt is US$1.08b.
A Look At PTC’s Liabilities
We can see from the most recent balance sheet that PTC had liabilities of US$792.3m falling due within a year, and liabilities of US$1.60b due beyond that. On the other hand, it had cash of US$272.2m and US$653.5m worth of receivables due within a year. So its liabilities outweigh the sum of its cash and (near-term) receivables by US$1.47b.
Given PTC has a humongous market capitalization of US$14.2b, it’s hard to believe these liabilities pose much threat. But there are sufficient liabilities that we would certainly recommend shareholders continue to monitor the balance sheet, going forward.
In order to size up a company’s debt relative to its earnings, we calculate its net debt divided by its earnings before interest, tax, depreciation, and amortization (EBITDA) and its earnings before interest and tax (EBIT) divided by its interest expense (its interest cover). Thus we consider debt relative to earnings both with and without depreciation and amortization expenses.
PTC’s net debt of 1.9 times EBITDA suggests graceful use of debt. And the alluring interest cover (EBIT of 9.6 times interest expense) certainly does not do anything to dispel this impression. We note that PTC grew its EBIT by 26% in the last year, and that should make it easier to pay down debt, going forward. The balance sheet is clearly the area to focus on when you are analysing debt. But ultimately the future profitability of the business will decide if PTC can strengthen its balance sheet over time. So if you want to see what the professionals think, you might find this free report on analyst profit forecasts to be interesting.
Finally, a company can only pay off debt with cold hard cash, not accounting profits. So we clearly need to look at whether that EBIT is leading to corresponding free cash flow. Over the last three years, PTC recorded free cash flow worth a fulsome 83% of its EBIT, which is stronger than we’d usually expect. That positions it well to pay down debt if desirable to do so.
Our View
The good news is that PTC’s demonstrated ability to convert EBIT to free cash flow delights us like a fluffy puppy does a toddler. And the good news does not stop there, as its EBIT growth rate also supports that impression! Looking at the bigger picture, we think PTC’s use of debt seems quite reasonable and we’re not concerned about it. While debt does bring risk, when used wisely it can also bring a higher return on equity. When analysing debt levels, the balance sheet is the obvious place to start. However, not all investment risk resides within the balance sheet – far from it. Case in point: We’ve spotted 3 warning signs for PTC you should be aware of.
If, after all that, you’re more interested in a fast growing company with a rock-solid balance sheet, then check out our list of net cash growth stocks without delay.
Valuation is complex, but we’re helping make it simple.
Find out whether PTC is potentially over or undervalued by checking out our comprehensive analysis, which includes fair value estimates, risks and warnings, dividends, insider transactions and financial health.
Have feedback on this article? Concerned about the content? Get in touch with us directly. Alternatively, email editorial-team (at) simplywallst.com.
This article by Simply Wall St is general in nature. We provide commentary based on historical data and analyst forecasts only using an unbiased methodology and our articles are not intended to be financial advice. It does not constitute a recommendation to buy or sell any stock, and does not take account of your objectives, or your financial situation. We aim to bring you long-term focused analysis driven by fundamental data. Note that our analysis may not factor in the latest price-sensitive company announcements or qualitative material. Simply Wall St has no position in any stocks mentioned.
Source link
