

David Iben put it well when he said, ‘Volatility is not a risk we care about. What we care about is avoiding the permanent loss of capital.’ So it seems the smart money knows that debt – which is usually involved in bankruptcies – is a very important factor, when you assess how risky a company is. As with many other companies Nokia Oyj (HEL:NOKIA) makes use of debt. But is this debt a concern to shareholders?
Why Does Debt Bring Risk?
Debt is a tool to help businesses grow, but if a business is incapable of paying off its lenders, then it exists at their mercy. In the worst case scenario, a company can go bankrupt if it cannot pay its creditors. However, a more frequent (but still costly) occurrence is where a company must issue shares at bargain-basement prices, permanently diluting shareholders, just to shore up its balance sheet. Having said that, the most common situation is where a company manages its debt reasonably well – and to its own advantage. When we examine debt levels, we first consider both cash and debt levels, together.
View our latest analysis for Nokia Oyj
How Much Debt Does Nokia Oyj Carry?
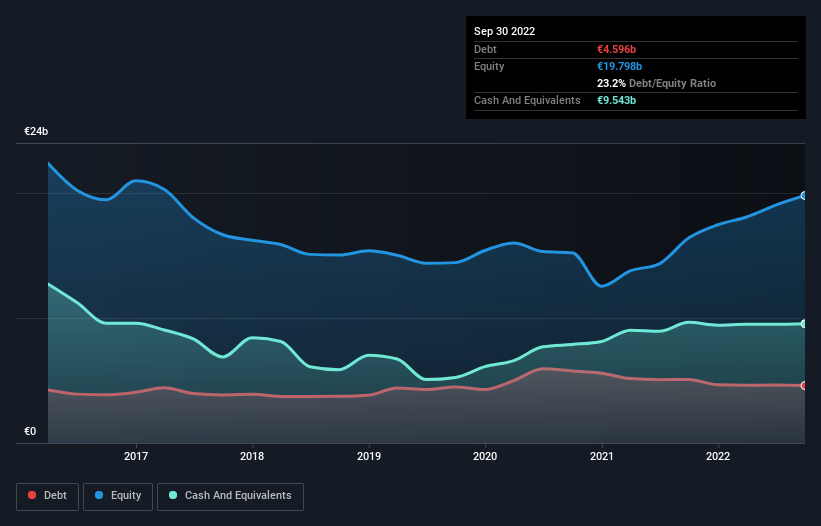
The image below, which you can click on for greater detail, shows that Nokia Oyj had debt of €4.60b at the end of September 2022, a reduction from €5.08b over a year. However, its balance sheet shows it holds €9.54b in cash, so it actually has €4.95b net cash.
How Strong Is Nokia Oyj’s Balance Sheet?
According to the last reported balance sheet, Nokia Oyj had liabilities of €13.7b due within 12 months, and liabilities of €9.36b due beyond 12 months. Offsetting these obligations, it had cash of €9.54b as well as receivables valued at €8.04b due within 12 months. So it has liabilities totalling €5.48b more than its cash and near-term receivables, combined.
While this might seem like a lot, it is not so bad since Nokia Oyj has a huge market capitalization of €23.6b, and so it could probably strengthen its balance sheet by raising capital if it needed to. However, it is still worthwhile taking a close look at its ability to pay off debt. Despite its noteworthy liabilities, Nokia Oyj boasts net cash, so it’s fair to say it does not have a heavy debt load!
But the bad news is that Nokia Oyj has seen its EBIT plunge 14% in the last twelve months. If that rate of decline in earnings continues, the company could find itself in a tight spot. There’s no doubt that we learn most about debt from the balance sheet. But it is future earnings, more than anything, that will determine Nokia Oyj’s ability to maintain a healthy balance sheet going forward. So if you’re focused on the future you can check out this free report showing analyst profit forecasts.
Finally, a business needs free cash flow to pay off debt; accounting profits just don’t cut it. Nokia Oyj may have net cash on the balance sheet, but it is still interesting to look at how well the business converts its earnings before interest and tax (EBIT) to free cash flow, because that will influence both its need for, and its capacity to manage debt. During the last three years, Nokia Oyj generated free cash flow amounting to a very robust 82% of its EBIT, more than we’d expect. That puts it in a very strong position to pay down debt.
Summing Up
Although Nokia Oyj’s balance sheet isn’t particularly strong, due to the total liabilities, it is clearly positive to see that it has net cash of €4.95b. The cherry on top was that in converted 82% of that EBIT to free cash flow, bringing in €828m. So we don’t have any problem with Nokia Oyj’s use of debt. Above most other metrics, we think its important to track how fast earnings per share is growing, if at all. If you’ve also come to that realization, you’re in luck, because today you can view this interactive graph of Nokia Oyj’s earnings per share history for free.
Of course, if you’re the type of investor who prefers buying stocks without the burden of debt, then don’t hesitate to discover our exclusive list of net cash growth stocks, today.
Valuation is complex, but we’re helping make it simple.
Find out whether Nokia Oyj is potentially over or undervalued by checking out our comprehensive analysis, which includes fair value estimates, risks and warnings, dividends, insider transactions and financial health.
Have feedback on this article? Concerned about the content? Get in touch with us directly. Alternatively, email editorial-team (at) simplywallst.com.
This article by Simply Wall St is general in nature. We provide commentary based on historical data and analyst forecasts only using an unbiased methodology and our articles are not intended to be financial advice. It does not constitute a recommendation to buy or sell any stock, and does not take account of your objectives, or your financial situation. We aim to bring you long-term focused analysis driven by fundamental data. Note that our analysis may not factor in the latest price-sensitive company announcements or qualitative material. Simply Wall St has no position in any stocks mentioned.
Source link
