

Warren Buffett famously said, ‘Volatility is far from synonymous with risk.’ When we think about how risky a company is, we always like to look at its use of debt, since debt overload can lead to ruin. We note that Signet Jewelers Limited (NYSE:SIG) does have debt on its balance sheet. But the more important question is: how much risk is that debt creating?
Why Does Debt Bring Risk?
Generally speaking, debt only becomes a real problem when a company can’t easily pay it off, either by raising capital or with its own cash flow. If things get really bad, the lenders can take control of the business. However, a more usual (but still expensive) situation is where a company must dilute shareholders at a cheap share price simply to get debt under control. Having said that, the most common situation is where a company manages its debt reasonably well – and to its own advantage. The first thing to do when considering how much debt a business uses is to look at its cash and debt together.
View our latest analysis for Signet Jewelers
What Is Signet Jewelers’s Net Debt?
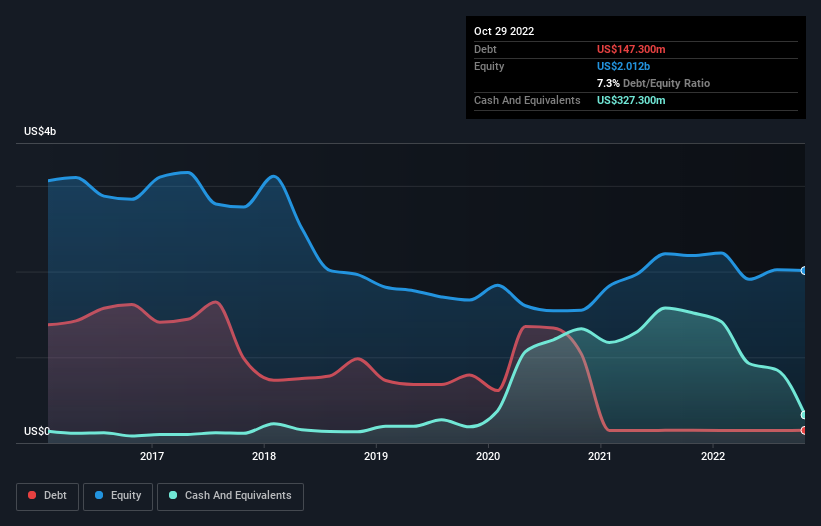
As you can see below, Signet Jewelers had US$147.3m of debt, at October 2022, which is about the same as the year before. You can click the chart for greater detail. However, it does have US$327.3m in cash offsetting this, leading to net cash of US$180.0m.
How Healthy Is Signet Jewelers’ Balance Sheet?
Zooming in on the latest balance sheet data, we can see that Signet Jewelers had liabilities of US$2.05b due within 12 months and liabilities of US$2.29b due beyond that. Offsetting this, it had US$327.3m in cash and US$251.8m in receivables that were due within 12 months. So its liabilities outweigh the sum of its cash and (near-term) receivables by US$3.76b.
When you consider that this deficiency exceeds the company’s US$3.25b market capitalization, you might well be inclined to review the balance sheet intently. Hypothetically, extremely heavy dilution would be required if the company were forced to pay down its liabilities by raising capital at the current share price. Given that Signet Jewelers has more cash than debt, we’re pretty confident it can handle its debt, despite the fact that it has a lot of liabilities in total.
On the other hand, Signet Jewelers saw its EBIT drop by 5.7% in the last twelve months. That sort of decline, if sustained, will obviously make debt harder to handle. The balance sheet is clearly the area to focus on when you are analysing debt. But ultimately the future profitability of the business will decide if Signet Jewelers can strengthen its balance sheet over time. So if you’re focused on the future you can check out this free report showing analyst profit forecasts.
Finally, a business needs free cash flow to pay off debt; accounting profits just don’t cut it. Signet Jewelers may have net cash on the balance sheet, but it is still interesting to look at how well the business converts its earnings before interest and tax (EBIT) to free cash flow, because that will influence both its need for, and its capacity to manage debt. Over the last three years, Signet Jewelers actually produced more free cash flow than EBIT. There’s nothing better than incoming cash when it comes to staying in your lenders’ good graces.
Summing Up
Although Signet Jewelers’s balance sheet isn’t particularly strong, due to the total liabilities, it is clearly positive to see that it has net cash of US$180.0m. The cherry on top was that in converted 154% of that EBIT to free cash flow, bringing in US$445m. So we don’t have any problem with Signet Jewelers’s use of debt. There’s no doubt that we learn most about debt from the balance sheet. However, not all investment risk resides within the balance sheet – far from it. For example – Signet Jewelers has 2 warning signs we think you should be aware of.
When all is said and done, sometimes its easier to focus on companies that don’t even need debt. Readers can access a list of growth stocks with zero net debt 100% free, right now.
Valuation is complex, but we’re helping make it simple.
Find out whether Signet Jewelers is potentially over or undervalued by checking out our comprehensive analysis, which includes fair value estimates, risks and warnings, dividends, insider transactions and financial health.
Have feedback on this article? Concerned about the content? Get in touch with us directly. Alternatively, email editorial-team (at) simplywallst.com.
This article by Simply Wall St is general in nature. We provide commentary based on historical data and analyst forecasts only using an unbiased methodology and our articles are not intended to be financial advice. It does not constitute a recommendation to buy or sell any stock, and does not take account of your objectives, or your financial situation. We aim to bring you long-term focused analysis driven by fundamental data. Note that our analysis may not factor in the latest price-sensitive company announcements or qualitative material. Simply Wall St has no position in any stocks mentioned.
Source link
